
TICK DATA
What follows is a summary of data that this project has generated so far. Most of this research has been conducted by students and teachers at New Philadelphia High School, New Philadelphia, Ohio and has been supported by grants from the Ohio Environmental Education Fund and the Entomological Society of America's Chrysalis Fund. During the 2024-2025 school year, we began recruiting teachers and students from other school districts to collaborate in this project.
Blacklegged Tick Density, Borrelia burgdorferi Prevalence, and Habitat (2024-2026)
Our earlier research has shown that 1) blacklegged ticks are common in all forests surveyed, 2) B. burgdorferi is common to all of these tick populations, and 3) both tick density and B. burgdorferi infection prevalence vary among forests. In Tuscarawas County, where New Philadelphia High School has done extensive sampling, densities of female blacklegged ticks (DOF) have ranged from 2.4 - 16.0 female blacklegged ticks per 100-m^2, and female B. burgdorferi infection prevalence (FIP) within these populations has ranged from 13 - 83%.
Fig 1 shows blacklegged tick population densities measured by schools participating in the AOTP from autumn 2024 - spring 2026. Sampling efforts were standardized at 50 x 15-m transects using a 1-m^2 tick drag (i.e. 750-m^2). Some forests were sampled at the ecotone boundary and at the interior, while others were surveyed only at one point (i.e. ecotone/edge or interior). We defined interior habitats as those that were > 15-m from the edge.

Fig 1. Map showing counties where blacklegged tick populations have been studied as part of the AOTP. County-level female blacklegged tick density (DOF) data obtained by high schools participating in the project between 2024-2026 are summarized at right.
A sub-sample of n = 24 female blacklegged ticks from each survey location was evaluated for the Lyme disease-causing pathogen B. burgdorferi using nested-PCR and gel electrophoresis. Fig 2 summarizes female B. burgdorferi infection prevalence (FIP) for forests surveyed during autumn 2024 - spring 2026 study period.
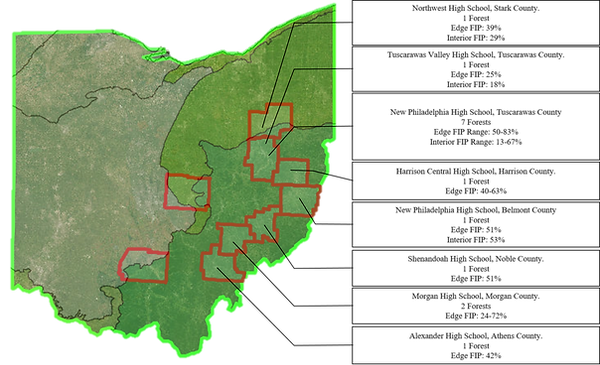
Fig 2. Map showing counties where blacklegged tick populations have been studied as part of the AOTP. County-level female blacklegged tick B. burgdorferi infection prevalence (FIP) data obtained by high schools participating in the project between 2024-2026 are summarized at right.
The Edge Effect
Based on our experiences sampling blacklegged tick populations, we hypothesized that blacklegged tick population densities would be higher, and Lyme disease risk greater, at the ecotone transition between forest and more open habitats, such as mowed lawns and fields. To examine this question, students at New Philadelphia High School measured blacklegged tick population densities and B. burgdorferi infection prevalence at edge and interior habitats of 6 forests in Tuscarawas County, Ohio during the 2025-2026 school year. Their results are summarized in Fig 3.

Fig 3. Results from a survey of blacklegged tick populations at forest interior and edge habitats of n = 6 forests in Tuscarawas County, Ohio during the autumn and winter 2025-2026. Bars show means + 1 SE. Asterisks denote significant differences. Both density of female ticks (DOF A) and density of B. burgdorferi infected female ticks (DIF, C) were significantly higher at edge habitats than at interior habitats (Mann-Whitney U-Test: p = 0.008 and p = 0.006, respectively). Female B. burgdorferi infection prevalence (FIP, B)did not differ significantly between interior and edge habitats (p = 0.470).
Our results showed that female B. burgdorferi infection prevalence (FIP) did not differ significantly between interior and edge habitats, but the density of female ticks (DOF) and density of B. burgdorferi infected female ticks (DIF ) did, suggesting that differences in tick density are possibly more important in determining Lyme disease risk than infection prevalence.
Stem Density
Looking holistically at data collected by schools in the AOTP suggests that tick densities at the interior of some forests can be quite a bit higher than the edges of other forests. We hypothesized that the main factor driving the generally higher tick densities on the edges of forests is their typically higher density of shrubs and other plant stems. We developed an index of relative stem density to qualitatively compare the stem densities of the habitats we surveyed (Fig 4). This allowed us to evaluate the effect of stem density on DOF, FIP, and DIF (Fig 5).

Fig 4. Graphic showing our "relative stem density index". This model grew out of our experiences with the diverse understory conditions of forests in our region. Forests with a 0 rating have mostly open understories that one could walk through and easily avoid emergent plant stems. Forests with a 1 rating have sparse understory shrubs and stems can be avoided by using care. Forests with a 2 rating have dense herbaceous and woody stems that are difficult to avoid and increasing densities of shrubs. Forests with a 3 rating are dominated by understory shrubs, which can be avoided only by careful maneuvering. Forests with a 4 rating are dominated by large aggregations of shrubs, which cannot be avoided. The establishment of a qualitative habitat index that is associated with Lyme disease risk offers a practical tool for helping people mitigate their risk of acquiring Lyme disease and other pathogens associated with the blacklegged tick.

Fig 5. We applied our relative stem density index to interior (red dots) and edge (white dots) samples for n = 6 forests in Tuscarawas County, Ohio. Note the fairly strong relationships between relative stem density and DOF (A) and DIF (C), but only a weak relationship with FIP (B). The association between relative stem density and DOF and DIF was significant (Spearman's rho: p = 0.003 and p = 0.006, respectively), whereas its association with FIP was not (p = 0.439).
Taken together, these data suggest that it may be the density of stems, and perhaps more specifically, shrubs, that makes DOF, DIF, and, thus Lyme disease risk, higher at edge habitats than forest interior habitats. One of our interior sites had a higher shrub density, creating more of what we might call "edge-like" conditions, and this site had similarly high DOF and DIF. Many of the forests cloaking the landscape today are young, highly fragmented, and invaded by a mix of exotic understory species, and we hypothesize that these conditions can create ideal habitat conditions for the blacklegged tick and B. burgdorferi. Of course, "correlation does not equal causation", but these data are intriguing, and suggest directions for further research that we anticipate exploring with the AOTP.
Earlier Data: 2020-2025
How does Borrelia burgdorferi infection rate vary in Blacklegged Tick Populations? (2020-2023)
The following map summarizes Borrelia burgdorferi (the etiologic agent of Lyme Disease) prevalence data for Blacklegged Tick (Ixodes scapularis) populations in Tuscarawas County, as well as that of a few populations in Stark and Summit Counties, Ohio. Each pin represents a location that we have surveyed. By clicking on a pin, you can access updated information on the prevalence of Borrelia in the ticks we have sampled there (as "percent positive for Borrelia") and the number of ticks that have been tested from that location.
As of 2023, we found that B. burgdorferi prevalence is quite high almost everywhere we look. We've looked most extensively in Tuscarawas County, where prevalence rates have ranged from 0% to 85% in questing adult ticks. It is worth noting that, of the 28 points sampled in Tuscarawas County in this map, the average B. burgdorferi prevalence was roughly 44 +18 SD %. Although some sites had really small samples of ticks that we tested (e.g., one site had only 2 ticks tested, two others had only 4 ticks tested), what this early sampling effort revealed was that B. burgdorferi and Blacklegged Ticks are quite common across the landscape of southeastern Ohio. Some locations had very high B. burgdorferi prevalence rates, and although we didn't measure tick densities at many sites during these early surveys, we did note differences in tick densities. What factors account for these differences?
Is there a relationship between tick densities, B. burgdorferi prevalence, and reported human Lyme Disease case rates?

During the 2023-2024 school year, students at New Philadelphia high school began looking beyond Tuscarawas County to explore relationships between the county-level reported human Lyme Disease (LD) cases per 100,000 and measured tick densities and B. burgdorferi prevalence rates within adult Blacklegged Tick populations. The map at right shows the Ohio Department of Health's reported LD case rates by county as of 2025. As you can see, the LD case rates vary, and counties with the highest numbers of cases are clustered in the east-central part of the state, which coincides with the northern edge of the Western Allegheny Plateau ecoregion.
We compared tick density and B. burgdorferi prevalence in two forests within Tuscarawas County (41 reported cases per 100,000), Stark County (9 reported cases per 100,000), and Summit County (4 reported cases per 100,000) to examine if the number of reported LD cases correlated with tick density and/or B. burgdorferi prevalence.
The following graphic summarizes the results of this study. The map to the left (A) shows the spatial arrangement of the survey locations used in this study. The bars in the graph (B) show the mean values for tick density (gray bars, ticks per 100 m^2), B. burgdorferi prevalence rate (orange bars, %), and reported cases (blue bars, per 100,000). The asterisks in the gray and orange bars show the actual values for each survey location.

On average, there was no significant difference in either tick density or B. burgdorferi prevalence across counties (one-way ANOVA with Brown-Forsythe correction: F2,1.099 = 0.428, P = 0.729 and F2,1.51 = 0.133, P = 0.887, respectively). Obviously, we are dealing with small sample sizes here, but one thing that was clear is that forested habitats across counties can have similar tick densities and B. burgdorferi prevalence. However, these variables, on their own, do not account for the differences in reported cases across counties.
Many potential variables can influence reported LD cases. There could be county-level differences in the number of physicians who actually report cases, differences in the number of people seeking medical care, differences in the number of cases correctly diagnosed, differences in the probability of people in a given county coming into contact with ticks, etc. One interesting consideration is the proportion of forest cover, since the Blacklegged Tick is primarily a forest-dependent species. Fifty-three percent of Tuscarawas County is covered in forest, whereas Stark County (25%) and Summit County (30%) have less forest cover, so it seems plausible that a greater amount of forest coverage could underly the higher case rates observed in Tuscarawas County. However, when one compares forest coverage and LD case rates across other heavily forested southeastern Ohio counties, the relationship no longer seems so simple. For instance, while Tuscarawas County has 41 cases per 100,000 and is 53% forested, Athens County has less than 6 cases per 100,000 and is 74% forested.
Is there a relationship between tick densities, B. burgdorferi prevalence, and reported human Lyme Disease case rates across the Appalachian region of Ohio?
Southeastern Ohio is the most heavily forested portion of the state, and so, for the 2024-2025 school year, we began examining how tick density, B. burgdorferi prevalence, and LD case rates varied across this region. To accomplish this task, we collaborated with teachers from 7 counties that formed a transect across this region. Students from each school selected at least one forested site to survey within their county and measured tick density and B. burgdorferi prevalence from questing adult female Blacklegged Ticks. The following map shows 8 counties that were studied during the 2024-2025 school year. They include (from north to south) Stark, Tuscarawas, Harrison, Belmont, Noble, Morgan, Athens, and Ross counties. The teal colored line on the map indicates the boundary of the Western Allegheny Plateau ecoregion, and the green color indicates forest cover. To the right of the graph are shown the county-level LD case rate, % forest cover, and our preliminary B. burgdorferi prevalence results from the 2024-2025 school year. Note that data from two counties were not yet compiled at this writing.

It is important to note that this is just the first year of this effort, so the data are very preliminary (e.g., only one forested site studied in most counties, it was the first year for most of the teachers and students involved, etc.). Still, we did attempt some analyses of observed patterns that will shape future research efforts.
Regarding the relationship between county-level reported LD cases and B. burgdorferi prevalence rates, we constructed the following regression using our preliminary data.

FIP is "Female Infection Prevalence" for B. burgdorferi. We found no significant correlation between reported LD cases and FIP (Pearson's r, P = 0.681).
Four sampling locations provided reliable estimates of both tick density and B. burgdorferi infection prevalence at forest edge and interior habitats. These sampling locations differed in forest size, so we examined the relationship between tick density (as density of questing adult female ticks, DOF), B. burgdorferi prevalence (as female infection prevalence, FIP), and forest habitat area. The following graphs show how DOF and FIP varied with forest area.

The first thing to note is that both tick density (A) and B. burgdorferi infection prevalence (B) tended to be higher at forest edges than at forest interiors. Although we did not discover any statistically significant differences, our sample sizes were small, and so we will focus future research efforts on evaluating the effect of edge and interior habitat conditions on these variables.
The second thing to note is how DOF (A) and FIP (B) for forest edge and interior locations both tended to decrease as forest area increased, and, along with that, how DOF and FIP of edge and interior locations seem to converge as forest area increases. Both DOF and FIP are important measures related to LD risk, and so these data suggest that larger patches of forest habitat may pose a lower LD risk than smaller, more highly fragmented patches. Further effort will be devoted to exploring the role that forest patch size might play in LD risk.